
Losing your marbles over data
By Mary Bigelow
Posted on 2010-03-20
Improving Your Students' Graphing and Graph Interpretation Practices
Tony Bartley (from Thunder Bay, Ontario) and Mike Bowen (from Halifax, Nova Scotia) discussed how to improve students’ data literacy. They reviewed types of data (nominal, ordinal, and integer/ratio) and the type of graph that would be appropriate for each.
Using simple materials such as marbles, paper cups, and a ruler, they engaged the participants in an activity that incorporated concepts such as data types, graphing, variables, line of fit, and interpreting data. By the end of our marble-rolling trials, we had the beginnings of a great bar graph.
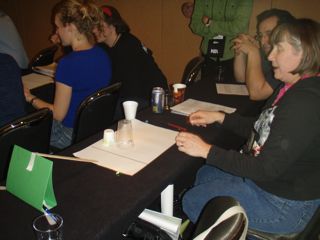
How far does a marble push a cup?
They noted that “science is a probabilistic endeavor. It doesn’t make absolute deterministic statements; it makes statements of probability.” They also shared a booket they created on data literacy for students (and teachers).
Disclaimer: The views expressed in this blog post are those of the author(s) and do not necessarily reflect the official position of the National Science Teaching Association (NSTA).