
Observing weather events
By Peggy Ashbrook
Posted on 2013-01-03
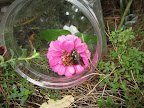 In the late fall as the weather alternated between 40°F and 70°F overnight, bumblebees sometimes got caught by cold temperatures and spent the night on the zinnia flowers in my garden. They would crouch around the inner section of the flower, so still that I could pet them very gently, with just once one finger. They were soft, just as I hoped, not the bristly feeling that wooly bear (Isabella tiger moth or Pyrrharctia isabella) caterpillars have. Some spent two nights on the flowers. Once when we had a downpour I cut the flower and put it inside a jar tipped to keep the rain out. I just didn’t like to see the bee exposed to the cold rain. The following day was sunny and the bee departed.
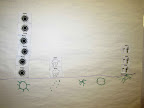 The bee behavior observation is one way to mark the temperature and other changes as the seasons change. What interesting natural events have you noticed that occur each year in your area or schoolyard? Young children notice some changes but others happen little by little and are not noted. Documenting the gradual changes of leave color changes or leaf drop, windy-ness or cloud cover can bring these changes to children’s attention.
The January 2012 Early Years column in Science and Children describes many different ways young children can collect data about weather and changes in the weather. Take a look at the weather data collection templates (NSTA Connections) and see if they could be used in your classroom. I’ve found that some children are very interested in recording data such as the amount of water collected in a rain gauge over night, and others are not. But if the “Weather Watcher” is added to the classroom job list, every child wants a turn.
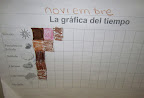
 Young children might use a thermometer that shows the temperature in terms of what clothing people are likely to wear. Kindergarteners may be ready to record temperature as where the “top of the red line” is located in groups of ten: 0-10, 10-20, 20-30, and so on. Children who are reading numerals can record temperature on a class graph, to compare over a long period of time.
Weather data collection from snow depth or rain gauges and, and thermometers on the playground or outside a window, can be offered to any who are interested. Their data can be brought to a group discussion, or simply posted on the wall to be discussed as the occasion presents itself. I hope none of the weather your children experience is dangerous but teachers must be ready to help children understand and face difficulties in life, including damaging weather. Here are some resources to learn more for such situations:
Crisis and Disaster Resources for Caregivers, a compiled list fromChild Care Aware® of America, lists resources from National Association of School Psychologists, The National Child Traumatic Stress Network and others.
Helping Children Cope with Natural Disasters by Karen Stephens from ChildCareExchange.
Do you have a favorite book about children noticing weather phenomena? I like the classics, Gilberto and the Wind by Marie Hall Ets, and The Snowy Day by Ezra Jack Keats, and newer works; Who Likes the Wind by Etta Kaner and illustrated by Marie Lafrance (2006, Kids Can Press), and Millions of Snowflakes by Mary McKenna Siddals and illustrated by Elizabeth Sayles (1998, Houghton Mifflin).
Disclaimer: The views expressed in this blog post are those of the author(s) and do not necessarily reflect the official position of the National Science Teaching Association (NSTA).