Go Wireless® Heart Rate
By Edwin P. Christmann
Posted on 2017-01-24
Introduction
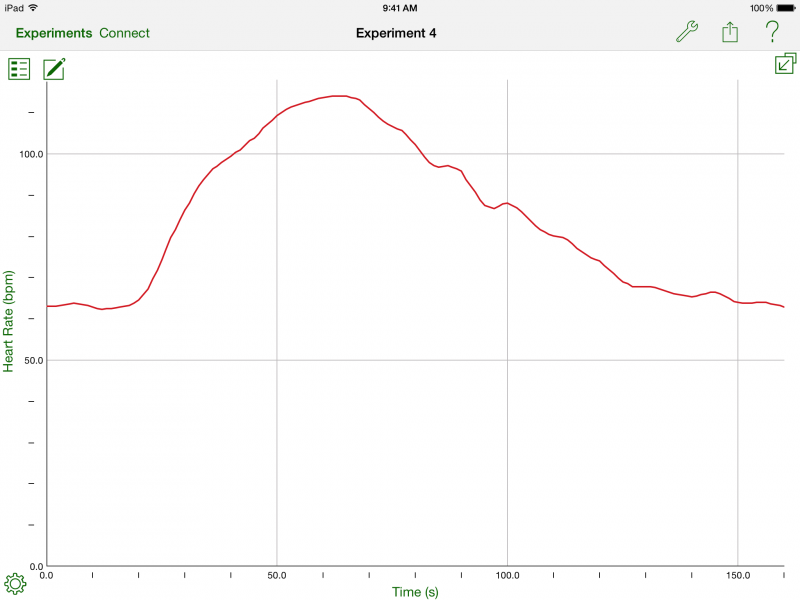
When studying the cardiovascular system, Vernier’s Go Wireless® Heart Rate monitor is an excellent way for students to engage in the collection of real data by having the opportunity to monitor their heart rates in a variety of ways. For example, students can take their pulse before, during, and after exercising. While doing so, the data is being collected and transmitted wirelessly through a Bluetooth sensor via a free “App” for either an Android or iOS device. Once downloaded, students can use the Graphical Analysis App to wirelessly collect, analyze, and share data collected from the sensor. Hence, students can do real-time graphs from the experimental data that can enhance their work and lab reports with easy annotations, statistics, and curve fits.
How does it work?
First, it is worth emphasizing that the Vernier’s Go Wireless® Heart Rate monitor is an incredibly user-friendly device. To get started, the first step before beginning an experiment is to download the Graphical Analysis App, which is compatible for iOS devices (version 2.2 or newer) at the App Store and Android devices (version 2.1 or newer).

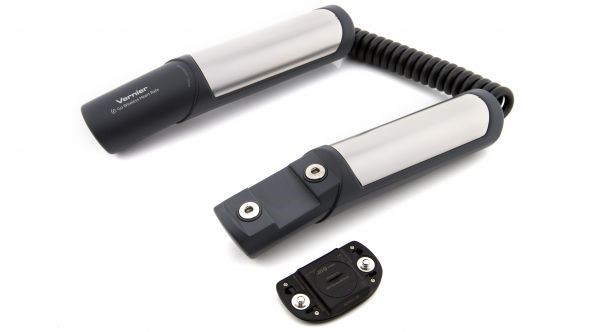
Once the download is complete, there are two separate components of interest: 1) the Heart Rate Hand Grips and 2) the Polar Transmitter Module (battery included). After you connect the Polar Transmitter Module, it detects each electrical signal from the heart from the electrodes on the hand grips. Subsequently, while holding the hand grips, the heart rate data is transmitted wirelessly to your mobile device. Since each device has a unique ID located on the side of the Polar Transmitter Module, by opening the Graphical Analysis App, you can identify the correct ID and proceed to analyze your data.

Because the data is collected in real time, the students can see the data being collected, which gives them an opportunity to examine how their physical activity levels affect pulse rate variations. Here are some examples of science activities that can be used with Vernier’s Go Wireless® Heart Rate monitor:
Heart Rate and Exercise: https://www.vernier.com/files/sample_labs/HP-A-04-COMP-heart_rate_exercise.pdf
Heart Rate and Blood Pressure as Vital Signs: https://www.vernier.com/files/sample_labs/HP-A-10-COMP-heart_rate_bp.pdf
Effect of Coughing on Heart Rate: https://www.vernier.com/files/sample_labs/HP-A-06-COMP-effect_of_coughing.pdf
Conclusion
Vernier’s Go Wireless® Heart Rate monitor is an exciting new tool to explore heart rate in the science classroom. Undoubtedly, it will give students a conceptual understanding of how different levels of exercise intensity can change heart rate variations and will also challenge your students to get out of their seats and enjoy this user friendly scientific device for meaningful learning. If you are looking for a way to maximize your students’ interest in learning about heart rate; Vernier’s Go Wireless® Heart Rate monitor is an excellent tool for meeting the instructional objectives.
Cost: $89
Product Site: https://www.vernier.com/products/sensors/heart-rate-sensors/gw-hr/
User Manual: https://www.vernier.com/files/manuals/gw-hr.pdf
Edwin P. Christmann is a professor and chairman of the secondary education department and graduate coordinator of the mathematics and science teaching program at Slippery Rock University in Slippery Rock, Pennsylvania. Anthony Balos is a graduate student and a research assistant in the secondary education program at Slippery Rock University in Slippery Rock, Pennsylvania.
Disclaimer: The views expressed in this blog post are those of the author(s) and do not necessarily reflect the official position of the National Science Teaching Association (NSTA).


