Designing a Model Shoreline
Fourth-grade students create a habitat for terrapins while reducing erosion.
Science and Children—March 2020 (Volume 57, Issue 7)
By Pamela Lottero-Perdue, Sarah Haines, Alison Baranowski, and Patricia Kenny

The fourth graders at Havre de Grace Elementary School were talking excitedly to one another and pointing to their spiral-bound science and engineering notebooks. They were discussing the model shorelines each had brainstormed to reduce erosion while creating habitat for terrapins. Comments bubbled up from the classroom as the students shared and justified their ideas: “we need a place for the terrapins to nest,” “we don’t want erosion into the bay,” “let’s use riprap,” and “terrapins like the wetlands.” We designed the Designing a Model Shoreline model shoreline challenge to apply and enhance student learning about Earth and life science, including erosion, habitats, wetlands, and life cycles. The two classrooms that we feature here are those of Ms. Baranowski (28 students) and Ms. Kenny (26 students). Ms. Baranowski and Ms. Kenny mentored three and four of Ms. Lottero-Perdue’s interns, respectively, during the unit. Interns taught small groups of students as we monitored and assisted the teaching and learning process.
Key Learning Experiences Prior to the Challenge
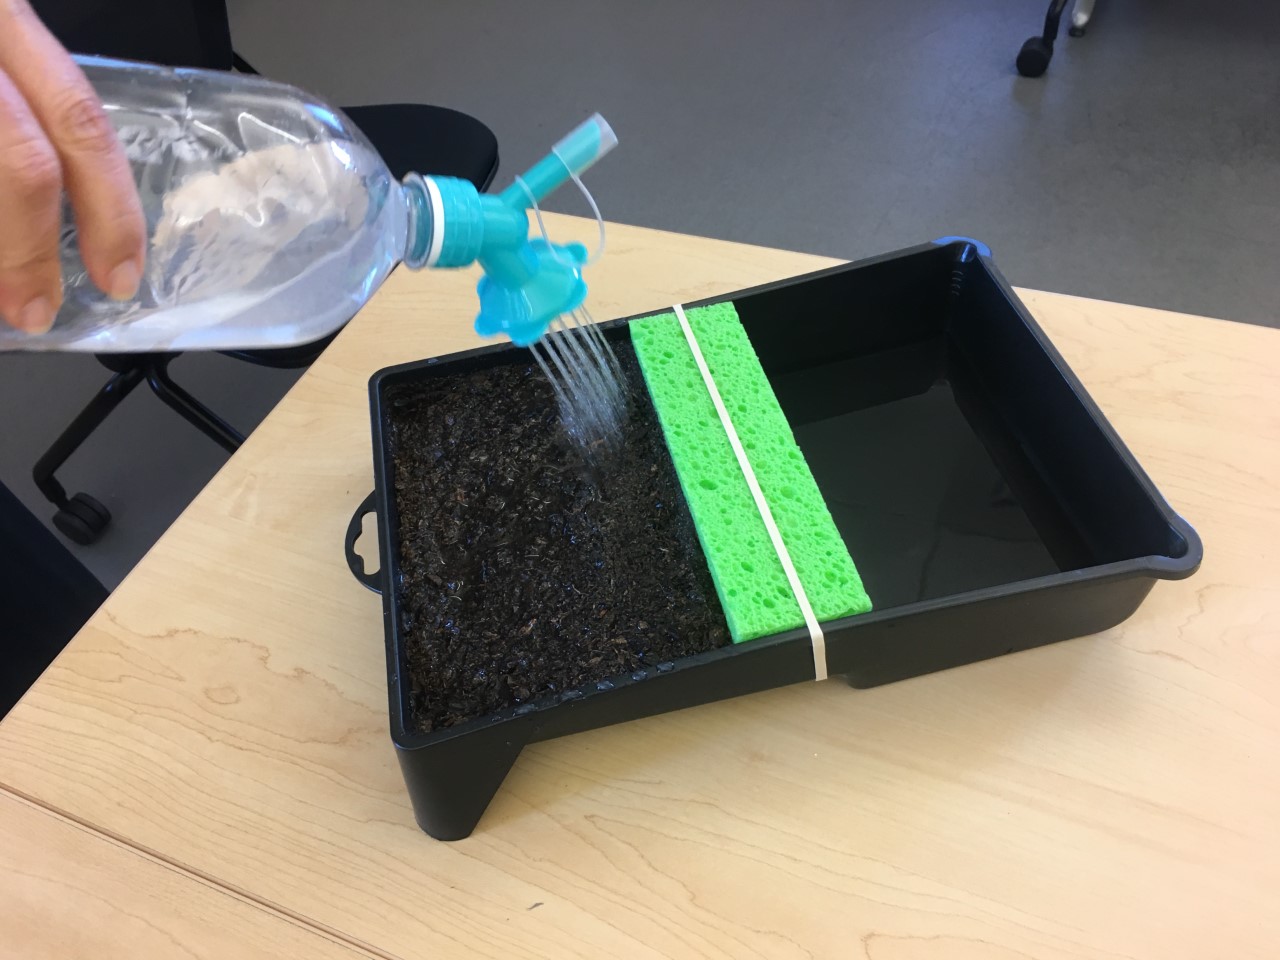
Wetland in a Pan Model. Students used a variety of models during the unit. One of these was “Wetland in a Pan” (Kesselheim et al. 1995). Land is represented by loose soil at the top of a 20 cm–wide paint tray, the bay was represented as the bottom of the tray, and a wide green sponge held in place by a rubber band represented wetland (Figure 1). We asked students: “Why do you think a sponge is a good representation of a model?” They recalled how wetlands soaked up water.
We conducted two demonstrations; each involved water raining onto the model land and then flowing into the model bay. In the first demonstration, the wetland was in place. In the second it was not. After the first demonstration, we asked: “What would happen if no wetland was here?” The students first made predictions and then observed as they assisted with the raining process. We used a rain bottle cap affixed to a 1L bottle to create the rain effect.
We added a simplified turbidity measurement to this activity. Turbidity is a measure of suspended sediment in water; in elementary terms, it is how cloudy the water appears. After each demonstration, we poured 30 ml of water from the model bay into a clear plastic cylinder under which a secchi disc (the black and white circle) was placed. Students looked from the top of the cylinder through the water sample and to the bottom toward the disc (Figure 2) and matched what they saw with a score on the Turbidity Score Chart (see Supplemental Resources). Students observed that without the wetland, the water was very turbid; with the wetland, the water was nearly clear.
Learning About Riprap and Wetlands. As a part of their learning about erosion, students were introduced to riprap. They learned that riprap:
- Refers to piles of rocks used to control erosion along shorelines and in drainage areas;
- Is sometimes held together with a meshlike wire (similar to chicken wire);
- Protects the shoreline from weathering; and
- Reduces the amount of erosion from the land into the water.
We took the students on a field trip to a quarry where rock for riprap and other uses is mined. We also went on a walking field trip to observe riprap and wetlands along the shoreline of the students’ hometown of Havre de Grace, a small city at the head of the Chesapeake Bay in Maryland.
Learning About Terrapins: Finally, students learned about a native species to the bay: diamond-backed terrapins. Through a read-aloud of Turtles in My Sandbox (Curtis and Schongut 2006) with additional supplemental information that we provided, students learned that terrapins:
- Find food and protection within wetlands;
- Look for sandy shorelines to come ashore and lay their eggs in the sand; and
- Typically cannot crawl over riprap (if they try, they are likely to get trapped between the rocks and die).
- Terrapin hatchlings crawl into the bay from their sandy nests immediately after hatching.
Designing a Model Shoreline
After using models throughout the unit, it was now the students’ turn to design a model. We presented the client and their needs to the students:
The city purchased a piece of shoreline on the bay previously owned by a private company. The company had started to develop the land, exposing soil up to the water’s edge. The city council wants to hire an environmental engineering firm to redesign the shoreline area to solve two problems: (1) too much erosion into the bay, and (2) not enough habitat for terrapins.
The goals for student teams were:
- To design a model shoreline that addresses the problems and is as affordable as possible for the city council; and
- To present their best model to the city council to compete for the job!
To address the first goal, students used an engineering design process familiar to them from the Engineering is Elementary (EiE) program: Ask, Imagine, Plan, Create, Improve (EiE 2019). The process took 3 hours: 90 minutes on Day 1 (Ask, Imagine, Plan) and 100 minutes on Day 2 (Create, Improve).
Ask: The Ask step involved asking and answering five questions: What is the problem? What is the goal? What are the constraints? What are the criteria? What do we know that is relevant to the problem or solution? We provided information to answer the first four questions and elicited prior knowledge from students to address the fifth. Students summarized this information in an Ask step graphic organizer affixed with stick glue in their notebooks (see NSTA Connection).
The constraints or limitations of the challenges were that each team:
Will start with 350 ml of soil on the top of the tray (same tray as the wetland activity);
- May add materials to their model shoreline, with each material representing a real-life component of a shoreline (e.g., sponges = wetland) (see NSTA for materials and costs chart);
- May move the soil around but may not remove soil or pile it above the top of the tray;
- Must include sand along water’s edge (so terrapins can come ashore);
- Must place wetland pieces between “upland” soil on the shore and water along the shoreline (since this is where wetlands typically form on coastal shorelines); and
- Must test their model shoreline by raining 350 ml of water for two minutes or less onto the entire shore/land area.
Three major criteria for the challenge were scored separately: (1) cost, (2) terrapin habitat quality, and (3) bay quality (see NSTA Connection for detailed criteria). The highest score for each of these criteria is six points; the higher the score, the better. The first row shows that the higher the cost, the lower the score; a lower score means that the shoreline is less affordable for the city.
Terrapin habitat quality was based upon three criteria, each two points; how much:
- wetland is available to the terrapins;
- nesting sand area is available before the rain; and
- nesting sand area is available after the rain.
Students used a 5 × 5 cm square of craft foam to estimate how many squares of nesting sand area were in their models.
Bay Quality consisted of two elements, each three points; both were assessed after the rain test:
- turbidity due to soil erosion; and
- sand erosion.
To quantify sand erosion, we affixed a laminated grid to the bottom of the bay area of the tray with glue dots. Students counted the number of squares on the grid that were covered by half or more with sand to determine the sand erosion score.
In this challenge, we focused on the three major criteria independently, more so than an overall score. These criteria in relation to one another represent tradeoffs. For example, increasing nesting habitat for the terrapins has the downside of increasing sand erosion.
Finally, it’s important to note that we determined the constraints and criteria for the challenge after multiple iterations of our own design and testing process. We aimed to create an experience for students that:
- was challenging but not impossible;
- included constraints that were based upon scientific ideas, real shoreline features, and natural events;
- utilized a testing procedure (rain test) that fourth graders could perform reliably; and
- was assessed by criteria that were connected to client needs and scientific ideas.
In future renditions, we could ask students to provide input on material constraints for the challenge, perhaps asking students to suggest possible materials to represent the riprap or wetlands that they observed on the walking field trip.
Imagine: Although students were assigned to work in teams of three, students first independently brainstormed their shoreline ideas. Each student did so by drawing two different ideas from a top-down perspective on a blank page in their notebooks. This part of the engineering design process took approximately 20 minutes.
Plan: Each team discussed their imagined ideas in their groups. They came to consensus on one idea, drawing the idea and listing needed materials and associated costs on a blank page in their notebooks. For some teams, coming to consensus was relatively easy; students combined ideas or decided to go with one particularly compelling one. For others, the consensus process was more difficult. Interns, who each managed two to three teams, intervened when necessary, asking students to justify their thinking to one another and suggesting compromise and flexibility. Team planning took about 25 minutes of instructional time.
We noticed that some of the plans failed to meet the constraint of having sand come to the water’s edge, and others did not follow the constraint of placing wetland between water and soil (e.g., they wanted to place wetland between sand and water). We paused the planning process to discuss these real constraints of nature that needed to be reflected in their models.
Create: The next day began with the Create step. Interns prepared team trays of materials based on plans and materials lists in students’ notebooks. Students then worked together to create their designs and test them using the rain test. Students should wear safety goggles during the Create and the Improve steps when building and testing their designs. Be sure students wash hands after working with soil.
Teachers or students can take digital pictures of the shorelines before and after the rain test. These can be uploaded for whole-class viewing or to enable the teacher to observe design performance after the hectic in-class testing period. Pictures can also be incorporated into students’ paper (using printouts) or electronic (using digital images) notebooks.
Students completed their score sheets—which were paper inserts of the criteria chart shared online—and affixed them into in their notebooks. One third of the teams mostly or completely employed riprap (using gravel and/or large rock); another third used much more wetland than rock; and another third used a more even mixture of rock and wetland. It took teams approximately 35 minutes to create and test their first model shorelines.
Improve: The improve step began with each team considering how their shorelines met or failed to meet criteria or constraints (Lottero-Perdue and Parry 2018). Teams also shared their designs and design performance with one another. They then determined which criteria they aimed to improve for their second try and how they would make those improvements (see NSTA Connection for graphic organizer). For example, some teams decided to provide more habitat for the terrapins, while others concentrated on reducing erosion. Each team then planned a new shoreline in their engineering notebooks. They created this design using a fresh tray, soil, and other materials and then tested it. Most teams’ second designs followed the design constraints and scored higher in at least one criterion than their first design. The Improve step took approximately 45 minutes.

Presentations to the Council
After testing their second design, students chose one of their two designs to present to the “city council,” which was in reality one or two other teams from the same classroom who had worked with the same intern. To prepare, students created a bulleted list of points in support of their design, including information about design performance and using scientific vocabulary and concepts. In this way, their chosen design was a claim, and their presentations were arguments with evidence in support of that claim. Their presentations told the story of their model, what it represented, and why it was a good model for the council to consider. Presentation preparation and delivery to one or two other teams took approximately 20 minutes.
Biology Environmental Science Elementary