commentary
Gender Identity Inclusive Pedigree Chart for High School Biology
A pedigree chart is a graphic representation of the inheritance of a genetic trait though multiple generations of a family. Scientists and teachers use pedigree charts to predict the probability of inheriting a genetic trait or genetic disease. Traditional pedigree charts identify individuals only as either those born male (squares) or those born female (circles).
Identifying individuals solely on the basis of their sex at birth does not acknowledge and respect students whose gender identity does not correspond with their designated sex at birth. Between 2015 and 2019, the percentage of 15- to 17-year-olds who identified themselves as “non-heterosexual” rose from 8.3% to 11.7%, according to the U.S. Centers for Disease Control and Prevention (Murez 2021). A recent study also found that transgender students were significantly less likely to have a positive perception of school connectedness compared to cisgender students (Pampati et al. 2020).
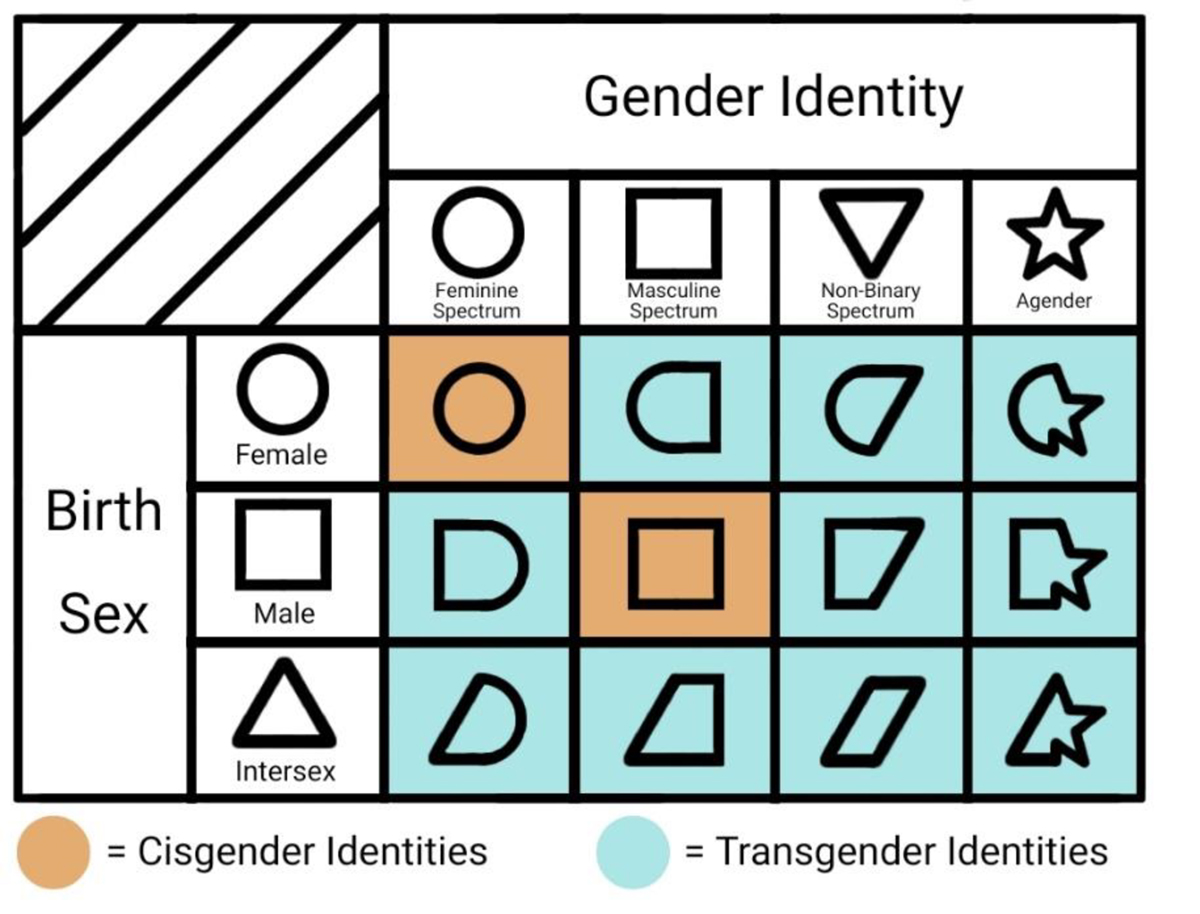
Science teachers have an opportunity and obligation to acknowledge and respect their bisexiual, transsexual, and intersex students by employing a modified inclusive pedigree chart. An inclusive pedigree chart, while still identifying sex at birth so that sex-linked traits can be tracked, acknowledges gender identities other than cisgender. Our chart was created to combine information regarding an individual’s designated sex at birth with their gender identity.
The left side of each symbol allows traditional tracking of genetic inheritance and the right side reflects individual genetic identities. By using an inclusive pedigree chart when teaching genetic inheritance, science teachers can serve to better support gender identity equality in their classes and schools.
Biology Equity Inclusion Multicultural Social Justice High School


