STEM Sims: Data Visualization
By Edwin P. Christmann
Posted on 2017-09-22
Introduction
STEM Sims provides over 100 simulations of laboratory experiments and engineering design products for applications in STEM classrooms. One particular simulation found on this site, Data Visualization, is a stimulating and imaginative tool for students to analyze a graphic representation of Napoleon’s 19th Century invasion of Russia. Hence, students use data provided with an 1889 graphic representation drawn by Charles Minard. The drawing is detailed and gives a variety of information about the military campaign. Subsequently, students are able to imagine they are military historians investigating and making inferences to analyze the success or the campaign. As is the case with all STEM SIMs software, Data Visualization is aligned with national (NGSS) standards (see below) and is compatible with state standards as well:
• MS-PS4.C – Information Technologies and Instrumentation
• MS-ESS2.D – Weather and Climate
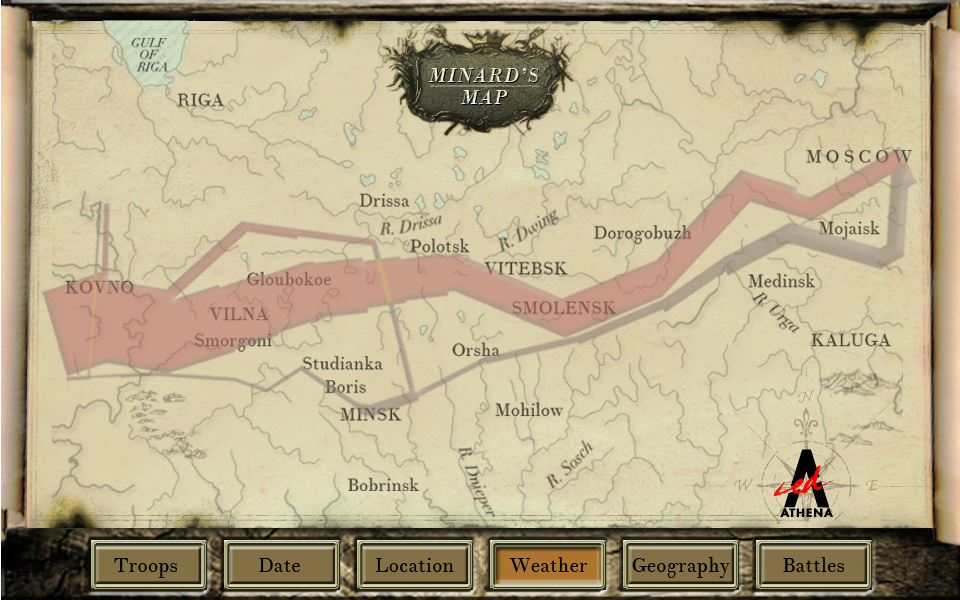
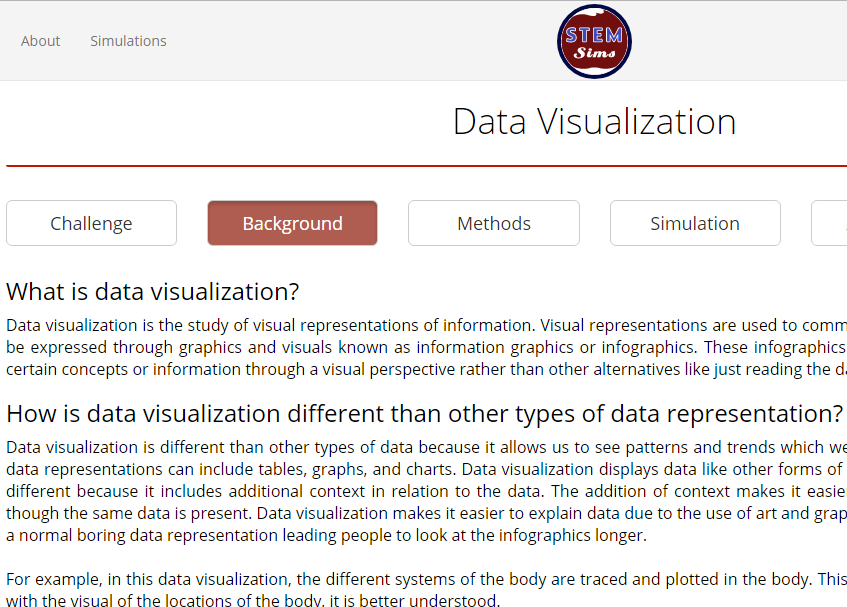
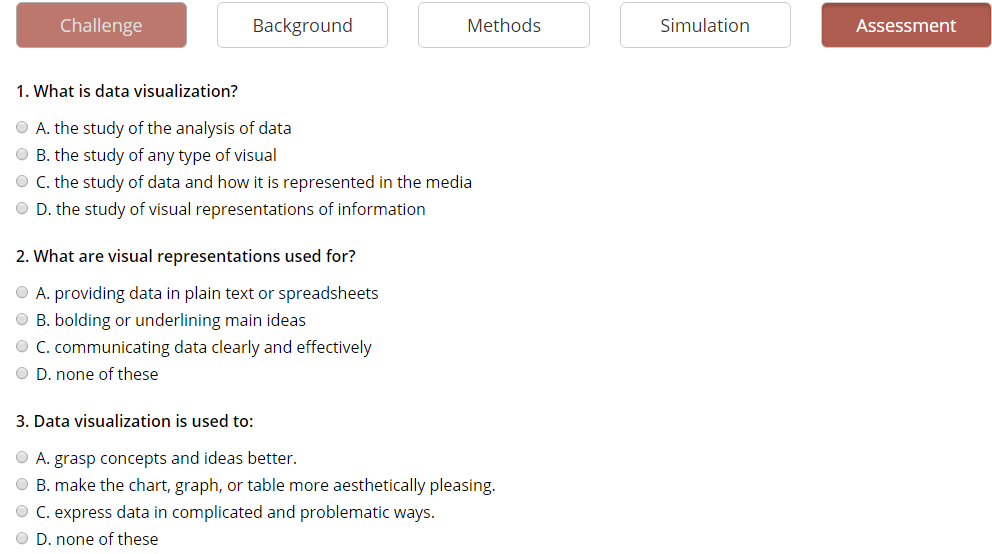
The simulation provides students with a brochure (see link below), a pre-assessment quiz, as well as introductory information about the concepts of Data Visualization. The simulation provides students with valuable data analysis skills; which offer an excellent content map that integrates mathematics, science, and social studies very well. Moreover, the activity challenges students to solve the problems of how and why the campaign failed, making it both engaging for students and stresses the higher levels of Bloom’s Taxonomy, e.g., Analysis and Evaluation.
Brochure: https://stemsims.com/simulations/data-visualization/brochure/brochure.pdf?version=2017-01-10
STEM Sims provides four separate lesson plans for this simulation (see links below) and provides an excellent learning opportunity for students while minimizing the planning needed by teachers:
Lesson 1: https://stemsims.com/simulations/data-visualization/lessons/lesson-1.pdf?version=2017-01-10
Lesson 2: https://stemsims.com/simulations/data-visualization/lessons/lesson-2.pdf?version=2017-01-10
Lesson 3: https://stemsims.com/simulations/data-visualization/lessons/lesson-3.pdf?version=2017-01-10
Lesson 4: https://stemsims.com/simulations/data-visualization/lessons/lesson-4.pdf?version=2017-01-10
Conclusion
Data Visualization, much like the other simulations on this site, gives students the opportunity to learn authentic and integrated STEM concepts. Moreover, this simulation provides science teachers with a valuable opportunity to work across the curriculum with other subjects. Therefore, science teachers will have the opportunity to work with other teachers and make more diverse connections with their science students. Consider signing-up for a free trial to evaluate this excellent simulation for your classroom and try to determine where this simulation fits into your instructional planning.
For a free trial, visit https://stemsims.com/account/sign-up
Recommended System Qualifications:
• Operating system: Windows XP or Mac OS X 10.7
• Browser: Chrome 40, Firefox 35, Internet Explorer 11, or Safari 7
• Java 7, Flash Player 13
Single classroom subscription: $169 for a 365-day subscription and includes access for 30 students and 100 simulations.
Product Site: https://stemsims.com/
Edwin P. Christmann is a professor and chairman of the secondary education department and graduate coordinator of the mathematics and science teaching program at Slippery Rock University in Slippery Rock, Pennsylvania. Anthony Balos is a graduate student and a research assistant in the secondary education program at Slippery Rock University in Slippery Rock, Pennsylvania
Introduction
The Vernier Three-Axis Magnetic Field Sensor: A Magic Wand for Magnets
By Martin Horejsi
Posted on 2017-09-21

What could be better than one anisotropic magnetoresistance magnetic field sensor? How about three anisotropic magnetoresistance magnetic field sensors and a Hall effect sensor as well! Pack them all into a lightweight watertight housing with a rechargeable battery and wired or wireless connectivity and you’ve got yourself a Vernier Three-Axis Magnetic Field Sensor.

Vernier Three-Axis Magnetic Field Sensor
I’ve been a fan of Vernier’s magnetic field sensors for decades, ever since the 1990s when my earth science students used the sensors with their primitive Apple laptops in the fields, hills, and caves of Craters of the Moon National Monument in Idaho.
Back then the magnetic field sensor was long cabled tube with amplification box that connected to a computer via a wired and powered interface box of some variety (Bluetooth hadn’t yet cut it’s teeth in classroom electronics yet so adding “less” to wire was years away). Still, the students loved making sine waves of magnetic field strength within the futuristic Logger software. Measuring the earth’s magnetic field, as well as the orientation of two thousand-year old basalt flows. Students could pick up a broken piece of basalt and using the Vernier Magnetic Field Sensor re-orient the stone in relation to the larger background rocks.
In the classroom, the student used the Vernier Magnetic Field Sensor to locate and map magnetic objects buried in sand, and even hypothesize about the objects size, shape, depth, and density using a control set of objects and sandbox.
Today Vernier offers a wireless Three-Axis Magnetic Field Sensor as part of their Go Direct series of sensors. Back in the 1990s it was a substantial update when the DIN connector changed to a BTA connector, and the beige serial connection box morphed into the translucent LabPro. To think that a couple blinking lights was exciting feedback from a battery-powered interface!

Go Direct sensors are a new class of Vernier probeware that evolved out of almost 40 years of science teaching hardware and software that built in or bolted on advancements in consumer technology including replaceable battery power, USB connectors, rechargeable batteries, mobile device compatibility, touch screens, multiple inputs, online support, digital curriculum, wireless communications, more touch screens, low energy Bluetooth, and now universal power and data connectivity using the EPS standard.
Today’s topic is the Go Direct Vernier Three-Axis Magnetic Field Sensor. The sensor is a breakthrough in capability, size, weight, price, and most important performance. The Vernier Three-Axis Magnetic Field Sensor measures magnetic field strength along three planes within one sensor. The 12.2 centimeter long probe (19 cm overall) has a tiny 0.7 cm footprint on the tip allowing the probe’s proboscis to be inserted inside some small spaces such as inside solenoids with no clumsy cables, or probe rotations to mimic three-axis measurements.

But should the need for a cabled connection between Go Direct sensor and digital device, that is certainly possible as well. Using the same micro-USB port that charges the internal battery, the Go Direct sensor can be hard-plugged directly into a computer. Why go wired when you could be wireless? Good question. The backwards compatibility allowing a copper connection over an electromagnetic one expands the usability of the sensor. A little-discussed element in the science lab is sacrificial computer or tablet. As technology ages, it looses it reliability, connectivity and security. By being able to buy the most modern digital sensor yet plug it into an obsolete machine for lab work fresh life is breathed into old tech. The Go Direct concept is also a significant upgrade when using BYOD (Bring Your Own Device) science classes because an old Windows machine will work along side a Macbook Pro next to a Chromebook, next to an iPad, next to an iPhone or Android smartphone.
But on to the Vernier Three-Axis Magnetic Field Sensor. By using multiple sensors built into a single 33 gram probe, the nimble Vernier Three-Axis Magnetic Field Sensor can be waved about like a magic wand, or maybe more like a symphony conductor’s baton as the student conducts their experiments. And at only 33 grams, that almost 14 Vernier Three-Axis Magnetic Field Sensors per pound.
So how does the sensor work? It uses two methods of measuring magnetic fields. The tip of the sensor has a +/- 5 mT chip that applies the property William Thompson (aka Lord Kelvin) observed in 1856, a phenomenon now called anisotropic magnetoresistance or AMR.
So what do you get when you mix the quantum physics effects of spin-orbit interaction with the magnetization of a material? Magic? Well actually anisotropic magnetoresistance. But it seems like magic. Ever wonder how a digital compass works? Like the kind in cell phone apps and GPS receivers. Do you think there’s a little magnet spinning in your phone? Actually, there might be, but not for the compass. Moving metal in a phone is how it vibrates when a call or text comes in. In the case of anisotropic magnetoresistance, there is an effect on electrical resistance between the direction of magnetization and its angle relative to an electrical current. Maximum electrical resistance occurs when the magnetic field is parallel to the direction of the electrical current. And of course the sensor must be calibrated for the job it will do.
In order to determine polarity of the magnetic field, a thin film of permalloy has strips of gold (or aluminum) laid across it inclined at forty-five degrees. With the current unable to flow along the normal path of least resistance, instead it is offset at and angle and thus forcing it to have a dependance around a neutral point. Like I said, magic.
Back in 1960 at the General Conference on Weights and Measures, the unit of Tesla was announced. One tesla is equal to one weber per square meter with the weber (Wb) being the SI unit of magnetic flux. The weber is named after the German physicist Wilhelm Eduard Weber.

Measuring the X-direction Magnetic Field Magnetic fields that point in the same direction the wand is pointing are recorded as positive, and fields that point in the opposite direction are recorded as negative. Thus, the magnetic field of the Earth will register as a positive field when the wand is pointed toward the magnetic pole in the Earth’s northern hemisphere, which is a South magnetic pole. When the wand is aligned with a permanent magnet and pointed toward the South pole of a magnet it will also record a positive field.

Measuring y- and/or z-directions The marks on the sides of the wand, at the tip, indicate the y- and z-directions of positive magnetic field measurements, as well as marking the location within the housing where the ±5 mT magnetic field sensor is located. This is important for consistent placing of the sensor and accurately measuring the distance between the sensor and the source of a magnetic field.
In the case of the Vernier Three-Axis Magnetic Field Sensor measurements of +/-5 mT are possible as well as measurements of +/-130 mT. How can this be, you might ask, with no switch between a high and low setting like on previous magnetic field sensors? Great question. Part of the magic of this sensor is that it is actually multiple sensors. About five millimeters from the tip of the sensor is the +/-5 mT anisotropic magnetoresistance sensor, and about 10.5mm from the tip is the +/-130 mT Hall effect sensor.
The tip of the sensor is noted with three embossed dots indicating the actual location of the sensors with two labeled as Y and Z with the third dot on the very end of the probe completing the triple capabilities of the Go Direct Vernier Three-Axis Magnetic Field Sensor

Just upstream a centimeter on the probe’s shaft is a Hall effect sensor for measuring a larger amount of magnetic flux. The Hall effect is the production of a voltage difference across an electrical conductor but transverse to an electric current in the conductor and to a magnetic field perpendicular to the current. Edwin Hall discovered the effect in 1879 while working on his doctoral degree at Johns Hopkins University. If only we could all be so lucky. And Hall did all this work almost two decades before the electron was even discovered!
At total of six data channels are measurable with the Go Direct Vernier Three-Axis Magnetic Field Sensor: X, Y, and Z magnetic field, and X, Y, and Z 130 mT magnetic field.
The durable sensor is water resistant, but the ~2.4 GHz of the Bluetooth signal is not. So underwater measurements would be a good candidate for using a USB wire.
The software to make the Vernier Three-Axis Magnetic Field Sensor really go to work is called Graphical Analysis 4. So powerful is GA4 that it will get its own writeup in the future. But don’t wait for that day. Download it for free now.

For when you want to hold the Vernier Three-Axis Magnetic Field Sensor stationary, there are many solutions. No tripod mount is on the sensor, but the sensor fits wonderfully in the Joby GripTight ONE Mount which then can be attached to a tripod. Of course you could also just use a rubber band.
Conducting experiments and inspections with magnets is as easy as waving your magic wand. Don’t have a magic wand? Then use the next best thing, a Go Direct Vernier Three-Axis Magnetic Field Sensor.
What could be better than one anisotropic magnetoresistance magnetic field sensor? How about three anisotropic magnetoresistance magnetic field sensors and a Hall effect sensor as well! Pack them all into a lightweight watertight housing with a rechargeable battery and wired or wireless connectivity and you’ve got yourself a Vernier Three-Axis Magnetic Field Sensor.
Safety Blog
Protecting Students From Fires
By Kenneth Roy
Posted on 2017-09-20
In 2015, the National Fire Protection Association released a revised version of NFPA 45 that included a new chapter titled “Educational and Instructional Laboratory Operations,” which applies to K–12 school laboratories. The new chapter provides fire protection and safety requirements for new and existing educational laboratories doing experiments or demonstrations using hazardous materials.
Most state legislatures will eventually adopt the updated NFPA 45 standard, meaning it is or will become a legal safety standard that school administration and teachers must follow
The Specifics
The first section (12.2: “Instructor Responsibilities”) of the new chapter clearly states that in a demonstration or experiment using hazardous materials, the teacher is required to:
• perform a documented hazard risk assessment,
• provide a safety review to students,
• provide adequate personal protective equipment, and
• place a safety barrier between students and the demonstration or experiment to prevent personal injury.
Furthermore, this section states that laboratory teachers must be trained and knowledgeable in fire safety procedures, emergency plans, lab hazards, appropriate PPE, and conducting an appropriate hazard risk assessment.
The second section (12.3 “Chemical Storage and Handling”) directs teachers to store bulk quantities of chemicals in locked rooms outside the classroom or store portioned amounts for each class session in a locked cabinet inside the lab. The second section also includes the following guidelines:
• Quantities of chemicals should not exceed the pre-laboratory unit quantities specified in local fire or building codes.
• Bulk quantities of chemicals in a prep room should be dispensed outside of the classroom or lab.
• If the lab does not have a prep room, the quantities of chemicals must be kept in locked cabinets before students arrive in the classroom or lab.
• The minimum amount of chemicals needed must be transferred to a smaller, appropriately labeled bottle.
Section 12.3.2 (“Performance of Experiments or Demonstrations”) again requires specific actions on the part of the teacher. For instance:
• Experiments or demonstrations must be performed in a location with access to an exit.
• Experiments or demonstrations involving hazardous quantities of fumes, vapors, particulates, or gases must be operated within a chemical fume hood.
• If it’s not possible to perform the activity in a fume hood, it must be performed behind an impact-resistant plastic or tempered glass safety shield.
• If the activity is performed outside of a fume hood where a shield is not used, students must observe the activity from at least 3 m (10 ft.) away.
• Activities using flammable liquids and open flames must be performed by a knowledgeable instructor.
• Teachers must review the hazards with students, required PPE, and review of emergency procedures.
In the end
NFPA 45 (2015) provides clear direction for science teachers to conduct safer demonstrations or experiments with students. The standard does not, however, prohibit the use of flammable solvents in school laboratories.
Submit questions regarding safety in K–12 to Ken Roy at safesci@sbcglobal.net, or leave him a comment below. Follow Ken Roy on Twitter: @drroysafersci.
NSTA resources and safety issue papers
Join NSTA
Follow NSTA
 |
 |
 |
 |
 |
In 2015, the National Fire Protection Association released a revised version of NFPA 45 that included a new chapter titled “Educational and Instructional Laboratory Operations,” which applies to K–12 school laboratories. The new chapter provides fire protection and safety requirements for new and existing educational laboratories doing experiments or demonstrations using hazardous materials.
Enhancing Google Sheets for the Classroom
By sstuckey
Posted on 2017-09-20
Among the most commonly used tools in the science classroom are those that allow students to collect and manipulate data, including Microsoft Excel, Graphical Analysis, and Google Sheets. This month, we focus on one of the benefits of Google Sheets that sets it apart from similar tools: the add-ons.
If you’re new to add-ons, first look under the add-ons menu in Google Sheets and click “get add-ons.” Once there, you may search for add-ons by category (i.e., Business Tools, Education, Productivity, Social & Communication, and Utilities).
Finding data
Sometimes simply finding data related to a certain scientific content area can be challenging. With the Knoema Data Finder add-on, students can browse a large database of data sets that can be immediately imported into a brand-new Google sheet. This is a great way to get students started on manipulating data.
Representing data
Students may then need to represent their data via equations or statistical representations. g(Math) for Sheets allows students to quickly create and insert complex formulas and graphs that may not be possible with the spreadsheet calculations or formulae included in the Sheets application.
Regular users of Google Forms know that the data collected by the form interface is usually destined for a Google Sheet. Unfortunately, each time a new submission is entered into a Google Sheet that contains Form results, a new row is created, and the formula is removed. The copyDown add-on resolves this issue by automatically applying a formula template to every new row of data for every Form entry. Through copyDown, students can predetermine what data they need to collect as well as the projected calculations that they need to use when they reference submitted data.
Once your students have begun to actively collect data from across a global community, they could represent that data visually by location across the world. Because certain physical properties (e.g., volume) can be different based upon variables such as elevation, temperature, and atmospheric pressure, ask students to connect those variables to the changes in properties to extend their thinking.

The Geocode add-on (sample map, above) can help make this connection. Geocode will automatically create a Google Map with placement markers at every location of submitted data. Just make sure that your students collect the address closest to the position of the collected data. When students scroll over the data points on the map, the content included in each row of data will also appear. The map can even be filtered based on selected columns of data. When this is combined with the calculations done by the copyDown add-on, students should be able to see patterns of data trends across the globe, thus strengthening the computational thinking skills involved with making predictions and forecasting results.
Conclusion
No matter how your students use Google Sheets, add-ons improve the functionality of the tool. There are hundreds of add-ons to help meet the instructional goals of your lessons and to help students achieve and learn.
Ben Smith (ben@edtechinnovators.com) is an educational technology program specialist, and Jared Mader (jared@edtechinnovators.com) is the director of educational technology, for the Lincoln Intermediate Unit in New Oxford, Pennsylvania. They conduct teacher workshops on technology in the classroom nationwide.
Editor’s Note
This article was originally published in the September issue of The
Science Teacher journal from the National Science Teachers Association (NSTA).
Get Involved With NSTA!
Join NSTA today and receive The Science Teacher,
the peer-reviewed journal just for high school teachers; to write for the journal, see our Author Guidelines, Call for Papers, and annotated sample manuscript; connect on the high school level science teaching list (members can sign up on the list server); or consider joining your peers at future NSTA conferences.
Among the most commonly used tools in the science classroom are those that allow students to collect and manipulate data, including Microsoft Excel, Graphical Analysis, and Google Sheets. This month, we focus on one of the benefits of Google Sheets that sets it apart from similar tools: the add-ons.
The Pasco Wireless Light Sensor: See the Light. And Measure it too.
By Martin Horejsi
Posted on 2017-09-18

Within an understated white plastic box is found a dynamic and versatile sensor that effectively measures many forms of light, and gives the science class a peek into how we learn about the universe we live in. Yes, the Pasco Wireless Light Sensor could easily go unnoticed in the science room’s box of technology. It would be understandable to think that this is just another sensor designed to fit into a lineup of other sensors. In fact there really isn’t much on the sensor to indicate just how powerful and versatile this particular sensor really is. There is only one button, the on/off switch. There is a tripod socket, a few words here and there printed on the case, and two apertures, a short black tube for spot measurements, and a flat white circle for ambient measuring. Like I said, uneventful.
But like most amazing gadgets these days, the real show begins when the device is paired with its software. So this little box measuring not much more than 2 x 4 x 7.5 cm actually has the capability to measure:
-Red light
-Green light
-Blue light
-White light
-Illuminance in lux
-Illuminance in lumens per square meter
-PAR (Photosynthetically Active Radiation) in sunlight
-Solar Irradiance in watts per square meter
-Ultra-violet A (UVA)
-Ultra-violet B (UVB)
-Calculate the ultra-violet index (UVI)
Further, the sensor can be so simple in appearance because the data leaves the sensor at the speed of light (in air) traveling over low energy Bluetooth radio waves to any receiving computer, tablet or phone. With a range of about 10m and a easily replaceable CR2032 battery, the Pasco Wireless Light Sensor is a about as perfect a light tool as a teacher can imagine. And speaking of light, it’s pretty much the only thing we get from the universe beyond the earth besides meteorites, solar wind, and sample return space missions, and that list is pretty short.

There is an abundance of concepts to study and light to measure so it follows that there is no shortage of traditional and innovative experiments for any grade level. The Pasco Wireless Light Sensor can easily measure the presence, absence and quantity of a handful of different kinds of light. And with each measurement, there is an ever expanding realm of possibilities, variations, and real-world analogs.


For instance, measuring sunlight is an obvious use of the Pasco Wireless Light Sensor, but wait, there’s more. That same sunlight can be reflected off surfaces, filtered through an endless number materials, fabrics, lotions, and films. UV through clothing can be measured with the fabric dry and wet. Sunscreens can be tested. Sunglasses, auto glass, and windows can be explored. And all of the above can be refined further by applying variables of distance and angles.
A bonus about the size of this sensor is that it happens to be the right size to fit into cell phone cradle or tripod mount. This fact allows the Pasco Wireless Light Sensor to be used effectively in existing and handy stands that can aim the Pasco Wireless Light Sensor as needed.

Color is fair game for the sensor with the Pasco Wireless Light Sensor’s unique ability (especially for the $55 price tag) to measure four colors of light…well three colors and their combination totaling up to white. The quantity of light moving through a filter, say sunglasses, is rarely across a uniform distribution of visible wavelengths. While we often worry about the amount of UV and IR in our sun shades, there are implications for colors. If sunglasses change colors or make them look similar, say green and red, then horizontal traffic lights could be read backwards. Another example is that sunglasses used around water may need to filter much more blue light than sunglasses used for other sports.
The inverse square law can be verified using little more than a meter stick, light source, and of course the Pasco Wireless Light Sensor.

Graphic of the inverse square law. Source: Wikipedia.
Two different apertures allow the Pasco Wireless Light Sensor to measure ambient light and narrower directional light sensor. The ambient sensor measures UVA, UVB, and UV index. The spot sensor measures general light level in several units, as well as relative intensity of red, green and blue light, or all three together as white light.
Bluetooth 4 is the Pasco Wireless Light Sensor communication method with iOS and Android mobile devices, and Mac and PC computers. A list of compatible hardware and software is listed here.
By removing the cables and going wireless, it’s possible to put the sensor in places where it might not be safe to be within the usual meter of wire, such as out in the sun for an hour. The Pasco Wireless Light Sensor can also be set up as a lab station where students log into the sensor to gather their data, then move on to the next station.

The Pasco Wireless Light Sensor is an excellent tool to teach science, and to do science. It’s tiny form factor and huge set of capabilities, but what makes it even more of a go-to solution is that the Pasco Wireless Light Sensor talks to smartphones putting a tremendous amount of science lab into a single pants pocket.

Light is an amazing thing. And even though its wildly prolific in the known universe, it’s Wikipedia entry is still less than half the length of that of Michael Jackson’s entry. Or about the same as an avocado. But whether you think light is a particle, a wave, a combination explained by electromagnetic, or quanta, or likely all (or none) of the above, light is an important aspect of almost every scientific subject. Which, given that line of reasoning, the Pasco Wireless Light Sensor just might be the most universal sensor when learning science.
Health Wise: Be Prepared for Opioid Overdoses
By sstuckey
Posted on 2017-09-18
In light of the national opioid epidemic, schools need to be prepared in case a student overdoses.  Consider:
- In 2016, 4.8% of high school seniors reported using opioids for nonmedical reasons (NIDA 2017c).
- From 2002 to 2015, annual opioid-related deaths grew 2.8-fold to 33,091, says the National Institute on Drug Abuse (NIDA 2017a).
- More than 90 Americans die every day from opioid overdoses (NIDA 2017b).
Opioids is a term that now refers to both synthetic chemicals such as oxycodone (OxyContin, Percodan, Percocet) and hydrocodone (Vicodin, Lortab, Lorcet) as well as drugs derived from opium poppies, such as codeine, morphine, and heroin. Opioids act on brain receptors that then produce dopamine, which causes feelings of euphoria.
The rise of prescription opioid abuse in the United States can be traced to the late 1990s, when pharmaceutical companies “reassured the medical community that patients would not become addicted to prescription opioid pain relievers,” NIDA says (2017b). “This led to widespread misuse of these medications.”
The use of non-prescription opioids, including heroin, often laced with fentanyl, a much more powerful synthetic opioid, have added to the death rate.
A good way to introduce the risk to students is the video Chasing the Dragon (see “On the web”), which features interviews with recovering opioid addicts who started using in high school.
A risk factor for youth is having parents with opioid prescriptions, according to a recent study (McDonald et al. 2017). Among 681 adults with children ages 7 to 17, some 88% reported that they did not lock away their opioids.
High school teachers should know the signs of an opioid overdose, NIDA says (2016a), including:
- pale or clammy face,
- limp body,
- purple or blue lips or fingernails,
- vomiting or gurgling noises,
- cannot be awakened or unable to speak, and
- breathing or heartbeat slows or stops.
Every second counts when someone is overdosing (NIDA 2016a). This is why some high schools now stock the medication naloxone, which can reverse the effects of an opioid overdose. Even non-medically trained people can administer naloxone nasal sprays and auto-injectors (NIDA 2016b).
“Naloxone has the potential to immediately restore breathing to a victim experiencing an opioid overdose,” according to a National Association of School Nurses policy statement recommending that schools have the rescue drug (NASN 2015). “Naloxone saves lives.”
Dr. Adrienne Weiss-Harrison, medical director of a New York school district, recently told a reporter: “We have [naloxone] the same way we have defibrillators and EpiPens” (Harris 2017).
Michael E. Bratsis is a former senior editor for KidsHealth in the Classroom (kidshealth.org/classroom).
On the web
Chasing the Dragon documentary and discussion guide: http://bit.ly/2cZSMuC, http://bit.ly/2rJA962
Order form for a free carton of naloxone nasal spray for high schools: www.narcan.com/partnerships
Lesson plans: http://nyti.ms/2qDcC2h, http://bit.ly/2sPRGJR
Student resources: www.teenshealth.org/en/teens/prescription-drug-abuse.html, www.teenshealth.org/en/teens/addictions.html
References
Harris, E.A. The New York Times. 2017. In School Nurse’s Room: Tylenol, Bandages and an Antidote to Heroin. March 29. http://nyti.ms/2ohU7PX
McDonald, E.M., A. Kennedy-Hendricks, E.E. McGinty, W.C. Shields, C.L. Barry, and A.C. Gielen. 2017. Safe storage of opioid pain relievers among adults living in households with children. Pediatrics 139 (3). http://bit.ly/2rO3BmA
National Association of School Nurses (NASN). 2015. Naloxone use in the school setting: The role of the school nurse. http://bit.ly/2rwQRl1
National Institute on Drug Abuse (NIDA). 2016a. Naloxone saves lives. https://teens.drugabuse.gov/blog/post/naloxone-saves-lives
National Institute on Drug Abuse (NIDA). 2016b. Should schools be ready for opioid overdoses? http://bit.ly/2dunOcY
National Institute on Drug Abuse (NIDA). January 2017a. Overdose death rates. http://bit.ly/1RxOFVr
National Institute on Drug Abuse (NIDA). May 2017b. Opioid crisis. http://bit.ly/2sLyfSS
National Institute on Drug Abuse (NIDA). 2017c. Opioids. www.drugabuse.gov/drugs-abuse/opioids
Editor’s Note
This article was originally published in the September issue of The
Science Teacher journal from the National Science Teachers Association (NSTA).
Get Involved With NSTA!
Join NSTA today and receive The Science Teacher,
the peer-reviewed journal just for high school teachers; to write for the journal, see our Author Guidelines, Call for Papers, and annotated sample manuscript; connect on the high school level science teaching list (members can sign up on the list server); or consider joining your peers at future NSTA conferences.
In light of the national opioid epidemic, schools need to be prepared in case a student overdoses. Consider:
Is Quality PD the Goal of STEM Certification? Here's What the AACT Has to Say
By Guest Blogger
Posted on 2017-09-15
For anyone who isn’t yet familiar with The American Association of Chemistry Teachers (AACT), here’s a bit about who we are. We’re 4,500 members strong, though we’ve only been around for three years. Most of us are teachers, and some are other chemistry professionals. We all care deeply about chemistry education and recognize that teachers of chemistry span all grade levels. We are the first national association by and for teachers of chemistry, and we’re proud to join the company of other science education organizations who share many of our goals.
We define our goals like this:
- We provide the best resources we can to support teachers of chemistry: everything from lesson plans to background reading to student materials to labs and demonstrations. Being a teacher is incredibly demanding and we hope to help our members feel positively rich in resources.
- We bring teachers of chemistry together in a functional network that enables both experienced and less experienced teachers to connect and learn from one another.
- We offer and advocate for targeted, quality professional development for teachers of chemistry. Great professional development empowers teachers with specific skills and tools they need to teach and empower their students.
The STEM Certification Conversation
When the conversation around STEM certification began, we saw that this effort would likely overlap with our interest in quality professional development, because, of course, the value of any certification is in the training, preparation, and experience that underlies it. As advocates for best-in-class professional development, we understand that seeking and renewing certifications are often the driving force behind time and funding being allotted for professional development.
There are certainly many teachers out there who could benefit from training and experience with STEM teaching methods and content. If a certification structure could bring those teachers the experiences and tools they need to better serve their students, then it’s a structure worth considering. Through AACT, we interact with many members who teach other sciences in addition to chemistry, and we appreciate initiatives that support practitioners of multiple disciplines.
In my own teaching career, having taught math and physics along with chemistry, I have gained a real understanding of the relationships among the disciplines. This has benefited my students, as I have been able to reveal those relationships in their classroom experience. The webinars that we have offered that deal with incorporating engineering, solving mathematical problems with intuition in stoichiometry and working without a calculator have all been well received and reflect our members’ interest in multiple disciplines.
Often times, practical know-how and tips for effective teaching are passed on through informal networks and mentorships among teachers. While that is certainly valuable, there is also value in formalizing and clarifying paths for seeking and attaining that knowledge. A clear, formal path can be widely available to all who aim to improve their practice. And, ultimately, the more teachers who benefit from training, mentorships, and so on, the more students those highly-trained teachers will be able to reach.
And aren’t the students what we’re all about in the end? AACT is proud to join our sister associations in pursuing top-quality education for all of our students by advocating for highly supported, well trained, teachers.
Jenelle Ball is the AACT President and Governing Board Chair. She has teaching high school chemistry for over 30 years. She currently teaches chemistry at Chico High School in Chico, CA.
Editor’s Note
This is the second post in a series from expert voices in STEM education who together are pondering questions about STEM certification. The first post in the series can be found here. Consider adding your thoughts about STEM certification in the comments below. As we tackle this issue and others like it, the steering committee for the STEM Forum & Expo will be building the program for the 7th Annual STEM Forum & Expo, hosted by NSTA, to be held July 11–13, 2018, in Philadelphia, PA. Please subscribe to the conferences category at http://nstacommunities.org/blog/subscribe/ to get updates as these blogs are posted.
Future NSTA Conferences
2017 Area Conferences
2017 Discover the NGSS “Train the Trainer” Workshops
2017 NGSS Administrator Institute
2018 National Conference
Follow NSTA
|
|
|
|
|
For anyone who isn’t yet familiar with The American Association of Chemistry Teachers (AACT), here’s a bit about who we are. We’re 4,500 members strong, though we’ve only been around for three years. Most of us are teachers, and some are other chemistry professionals. We all care deeply about chemistry education and recognize that teachers of chemistry span all grade levels.
The TI-Innovator Rover: A Vehicle for Coding a Vehicle
By Martin Horejsi
Posted on 2017-09-15

With all the connectivity possible built into the TI-Innovator Hub, it was inevitable that programable motorized peripherals would become available for I-Hub. And that day has arrived. Texas Instruments, the maker of the ubiquitous graphing calculators like the TI-84, has announced the TI-Innovator Rover, a two-wheeled programmable robotic vehicle designed to work directly (hardwired) with the TI-Innovator Hub.
A 360 degree tour of the TI-Innovator Rover is available here, but below are a few more screenshots of the Rover.


The TI-Innovator Hub was detailed on this NSTA Blog back in December. We were impressed with the Hub’s ability to provide feedback and control options in as little as 10 minutes. The coding process of the Hub required an appropriate TI graphing calculator so the coding experience involved a command-line interface rather than the drag-and-drop “language” of many more toy-like coding devices. The current list of comparable calculators includes one model of the 84 (Plus CE), and seven TI-Nspire hardware/software combinations.

According to Peter Balyta, the president of TI Education Technology, “We created Rover to demystify robotics and give students who might be intimidated by programming an easy on-ramp to learn to code. Given the sheer joy we have seen on students’ faces as they learned to code during our testing phase, we are excited to see how Rover will inspire more young minds through an introduction to robotics.”

The TI-Innovator Rover leverages the ubiquitous TI family of graphing calculators and requires a command-line understanding of the coding process. While the learning curve might be steeper for command-line coding, the capabilities are not limited by an available set of drag-and-drop code icons.

The aluminum TI-Innovator Rover with rechargeable battery has two independent drive wheels, a motor shaft encoder, a gyroscope, color sensor, LED lights, and a marker holder that will lay a path for science, art or both at the same time.
TI-Innovator Rover puts STEM into motion. I’m excited to take it for a drive when available.
Ed News: Nebraska’s New Education Standards To Include Climate Change
By Kate Falk
Posted on 2017-09-15

This week in education news, Louisiana to start push to boost student interest in STEM, especially among women; Nebraska approves new science education standards that include climate change; Gallup 2017 Survey of K-12 superintendents highlights challenges facing districts; Next Generation Learning Standards to replace Common Core in New York; coding and the rise of STEAM learning are the trends to watch in K-12 educational technology this year; and California gets waiver from administering old science tests.
State Starting Push For More Science, Math And Engineering Students, Especially Among Women
Louisiana is about to launch a new bid to elevate one of the hottest fields in education, and improve on the dismal number of women in science, technology, engineering and math. The targeted careers will be the topic of an influential panel authorized by the Legislature earlier this year. The goal is to boost student interest in science, technology, engineering and math; align those skills with fast-growing workforce needs and increase the number of women with STEM degrees. Read the article featured in The Advocate.
Nebraska’s New Education Standards To Include Climate Change
The Nebraska State Board of Education has approved new science standards that will see the state’s public schools teaching climate change for the first time. The board voted 6-1 to approve the standards. Read the article by the Associated Press.
Gallup 2017 Survey Of K-12 Superintendents Highlights Challenges Facing Districts
According to the Gallup 2017 Survey of K-12 School District Superintendents, a majority of district leaders report that the greatest challenges facing their schools are budget shortfalls and assisting students whose achievement is impacted by socioeconomic conditions. Additionally, the data finds superintendents in urban or suburban districts are more likely to be engaged than those in their town or rural counterparts, and 66% across all types of districts are seeing fewer new teacher candidates. Read the brief featured in Education DIVE.
‘Common Core’ No More: New York Moves To Adopt Revised Standards With New Name
It’s official: New York has moved to adopt a revised set of learning standards that, among other changes, ditches the politically charged “Common Core” moniker. New York’s Board of Regents voted in committee Monday to accept the Next Generation Learning Standards, capping off a nearly two-year revision process. Read the article featured in Chalkbeat.
Report On Underrepresented STEM Students
A new 68-page report from the Pullias Center for Higher Education at the University of Southern California hopes to address underrepresented students in STEM. The report emphasizes collaboration between existing academic affairs and student affairs programs — which are often separated — as well as specific interventions for struggling students. Read the article featured in Inside Higher Ed.
Coding, Robotics, Makerspaces Poised To Grow In Schools, Report Says
Coding and the rise of STEAM (science, technology, engineering, arts, and math) learning are the trends to watch in K-12 educational technology this year, and schools may be expanding robotics programs and makerspaces, which are physical environments for hands-on learning, predicts a recent report from the New Media Consortium and the Consortium for School Networking. Read the article featured in Education Week.
Why We need To Change The Teacher Vs. Tech Narrative
A recent chart from Bloomberg on the future of artificial intelligence and employment lends evidence to a point I have been making for years: teachers will not be replaced by machines. The chart compares a wide array of professions based on required education levels, average annual wages, and likelihood of automation. Sure enough, elementary and secondary teachers are among the most educated yet least paid professionals; and their likelihood of automation: practically zero. Read the article featured in eSchool News.
California Gets Waiver From Administering Old Science Tests, But Only For Last Year
In a partial victory for California, the U.S. Department of Education has granted the state a retroactive waiver from administering outdated science tests, instead allowing it to give students pilot tests based on new science standards. But the department granted the waiver only for the just completed school year. It made it clear that the waiver doesn’t apply to the current school year, and that if California did the same thing it did last year it could run afoul of the law and risk penalties that could include losing federal funds. Read the article featured in EdSource.
This Law Could Help States Prioritize Science Education
States have a new opportunity to emphasize science education and achievement–once largely ignored during the NCLB era–under new federal policies. ESSA gives states opportunities to create new educational goals and strategies, and states can set clear-cut goals for science achievement and leverage existing policies to meet those goals, according to a new brief from Achieve. The brief takes a look at science education efforts in the 16 states, plus the District of the Columbia, that submitted plans to the U.S. Department of Education during the first round of submissions in May 2017. Read the article in eSchool News.
Mom: My Daughter’s Kindergarten Teachers Asked Me What Motivates Her. I Find That Troubling.
Jane Dimyan-Ehrenfeld is a parent, educator and attorney who now serves as executive director of the Washington D.C.-based Center for Inspired Teaching, a nonprofit organization that trains teachers to use best practices and rethink their traditional roles in the classrooms. Here’s a piece by Dimyan-Ehrenfeld, who tells a personal story to discuss a key problem with the basic structure of most schools. Read the article featured in The Washington Post.
Could An APP Help Teachers Recognize Their Own Biases?
A Michigan State University professor has designed an app that helps teachers recognize their implicit biases using data collected from their own classrooms. Assistant professor of teacher education Niral Shah will test the app in 6th through 12th grade math classes in Michigan over the next two years. His colleague, assistant professor of STEM education at San Diego State University, Daniel Reinholz, will test the app in advanced math college classrooms. The two will explore how data generated by the app, coupled with information on students’ own experiences with equity and bias, can help educators make sure they are aren’t unconsciously excluding anyone. Read the article featured in Education Week.
Stay tuned for next week’s top education news stories.
The Communication, Legislative & Public Affairs (CLPA) team strives to keep NSTA members, teachers, science education leaders, and the general public informed about NSTA programs, products, and services and key science education issues and legislation. In the association’s role as the national voice for science education, its CLPA team actively promotes NSTA’s positions on science education issues and communicates key NSTA messages to essential audiences.
The mission of NSTA is to promote excellence and innovation in science teaching and learning for all.
Follow NSTA
|
|
|
|
|
Focus on learning activities
By Mary Bigelow
Posted on 2017-09-14
 My fourth-grade students like doing hands-on science activities. How can I get them to focus on the activity rather than socializing? —C., West Virginia
You want students to enjoy the activity and talk with each other, but students need to understand the activity is purposeful and not “free” time. Your preparation and routines will make the difference.
Teachers often assume students know how to work cooperatively. Model and practice the routines for each role and appropriate conversations.
To save time accessing materials, I used numbered trays for each group with necessary materials and a list of the items to help students inventory and return them.
Introduce the activity’s purpose and describe the expected result (e.g., report, table or graph, drawing, model, list of questions, summary, or new ideas to share). Remind students of safety issues and their roles in cooperative learning (e.g., data recorder, equipment manager, clean-up, question-asker).
As you monitor the activity, ask students about what they’re doing and reinforce appropriate behaviors. This is also a time for formative assessments of students’ skills in lab and safety procedures, measurement, and data recording. Deal immediately with individuals or groups who are off-task or engaging in unsafe or distracting behaviors. If things get out of hand, stop the activity and refocus the students back on the activity.
Allow time to summarize the activity and clean up before the end of the class. This gives students time to settle down, focus on what they did, and transition to the next subject or class.
It’s important that students understand a science activity is as much of a learning event as a worksheet or teacher-led discussion—and probably more so.
Photo: http://www.flickr.com/photos/xevivarela/4610711363/sizes/o/in/photostream/
My fourth-grade students like doing hands-on science activities. How can I get them to focus on the activity rather than socializing? —C., West Virginia
You want students to enjoy the activity and talk with each other, but students need to understand the activity is purposeful and not “free” time. Your preparation and routines will make the difference.